The week that started the question
A post circulated widely in late October listing, in a single breathless paragraph, everything that had gone wrong in a few days. Someone shared it on Facebook with a simple question: do you ever get the sense that things are accelerating? Before answering, it is worth checking the paragraph itself, because most of it holds up.
On 21 October 2026 PHP, the server language behind roughly 70% of websites whose technology can be identified, shipped emergency fixes for two flaws now known as PHP2Shell (CVE-2026-109618 and CVE-2026-109619). Both allow an attacker who is not logged in to run code on a web server. Details leaked before the fix was ready, so the FBI and NSA, the UK's NCSC and Japan's national cybersecurity office advised anyone unable to patch immediately to take their systems offline; CERT-EU advised isolating them from public networks. According to Censys data reported by Reuters, about 1.5 million of 2.6 million hosts were running a PHP version for which no fix exists. Government sites in the Netherlands, Finland and France went dark as a precaution — in the Netherlands including Overheid.nl, MijnOverheid and DigiD — and so did the Dutch cybersecurity agency's own site, the Port of Rotterdam's, some Wikipedia systems and, briefly, the Internet Archive. Dutch media reported that the national news agency ANP also switched off some systems as a precaution. Japan's Prime Minister, Sanae Takaichi, posted an urgent appeal to website owners on X that evening.
The rest of the list is also documented: GitLab's second maximum-severity (CVSS 10) remote-code-execution flaw in ten days; a hijacked release of LiteLLM, a widely used AI gateway, that shipped a credential stealer and remote-access trojan for about two hours — its second compromise this year; Railway pausing all deployments after intruders reached customers' stored secrets; a joint US–German–UK advisory saying the SafePay ransomware group had hit at least 600 critical-infrastructure organisations since 2024; more than 300 hijacked Tor exit relays intercepting SSH logins; and eMudhra, an Indian certificate authority, whose intermediate private keys turned out to be tiny numbers — one of them literally 4 — prompting Google, Mozilla, Apple and Microsoft to block eight certificates.
Three details in the viral version need correcting. PHP's official severity score is 9.2 out of 10, not 10. Japan's "state of emergency in cyberspace" was a phrase used on 9 October by Masaaki Taira, head of the ruling party's cybersecurity headquarters, at a party meeting after breaches at more than 20 major companies — the government itself declared no emergency. And the Prime Minister's post went out on Wednesday night, ahead of the 11 pm Tokyo release of the fix, not at dawn. The underlying events are real.
So the question is fair. But one bad week is a point, not a curve. To see whether things are accelerating we need the curves.
How to read the curves
There is no single number for "cybersecurity". What exists are long-running series, each measuring something different and each with its own blind spots. I used the ones that are public, methodologically stable and published by the bodies that collect the data: the CVE programme (vulnerabilities disclosed), the FBI's Internet Crime Complaint Center (reported losses), Mandiant's M-Trends (how long intruders stay undetected and how quickly flaws are exploited), Google's zero-day reviews, CISA's catalogue of exploited vulnerabilities, Chainalysis and Coveware (ransomware), IBM/Ponemon (breach costs), Verizon's DBIR (how breaches start) and ENISA (Europe).
Two cautions apply throughout. First, many of these series measure detection and reporting as much as attacks: more vulnerability numbering authorities produce more CVEs; more awareness produces more complaints to the FBI. Second, "accelerating" has a precise meaning. Something that grows 30% every year grows exponentially, and feels relentless, but it is not accelerating; the growth rate itself has to rise. That distinction turns out to matter.
What is genuinely accelerating
1. The volume of known flaws
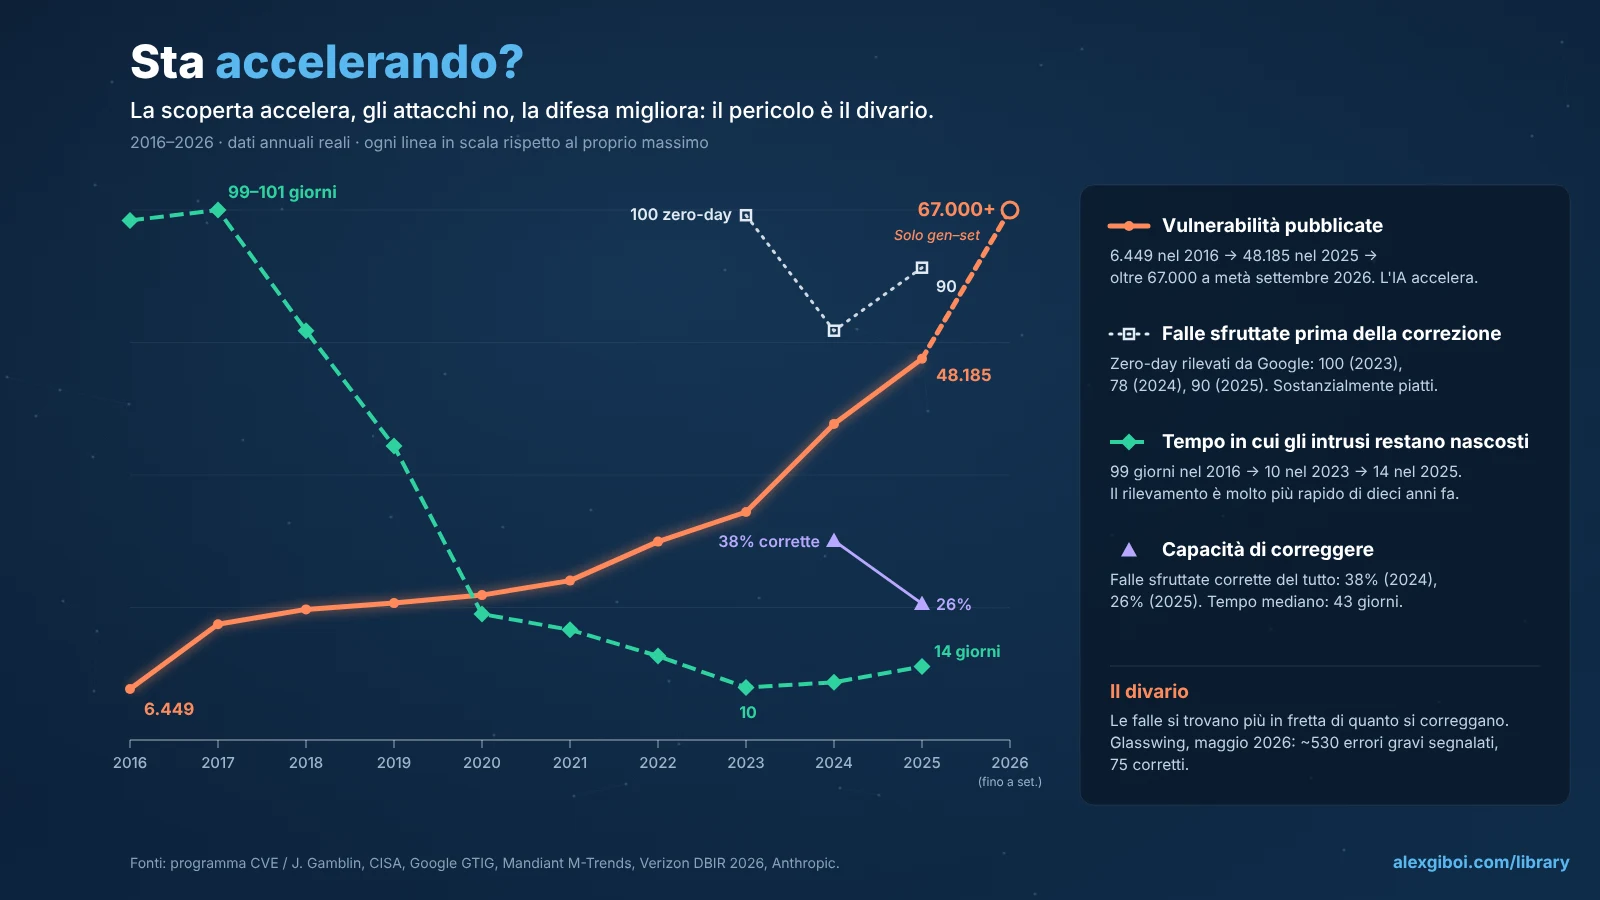
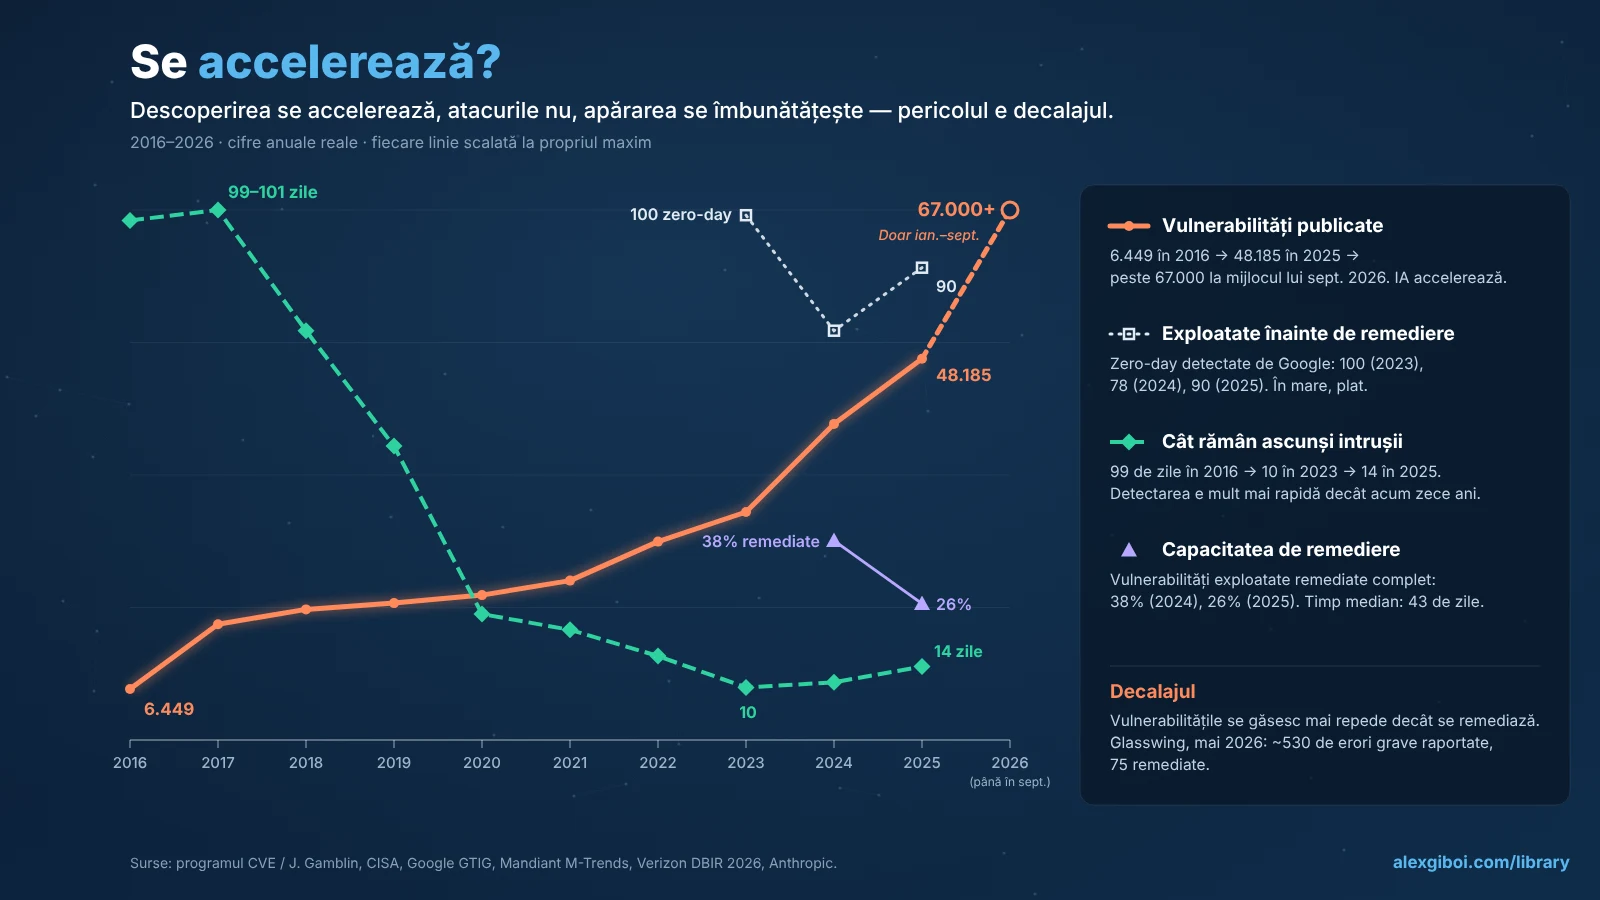
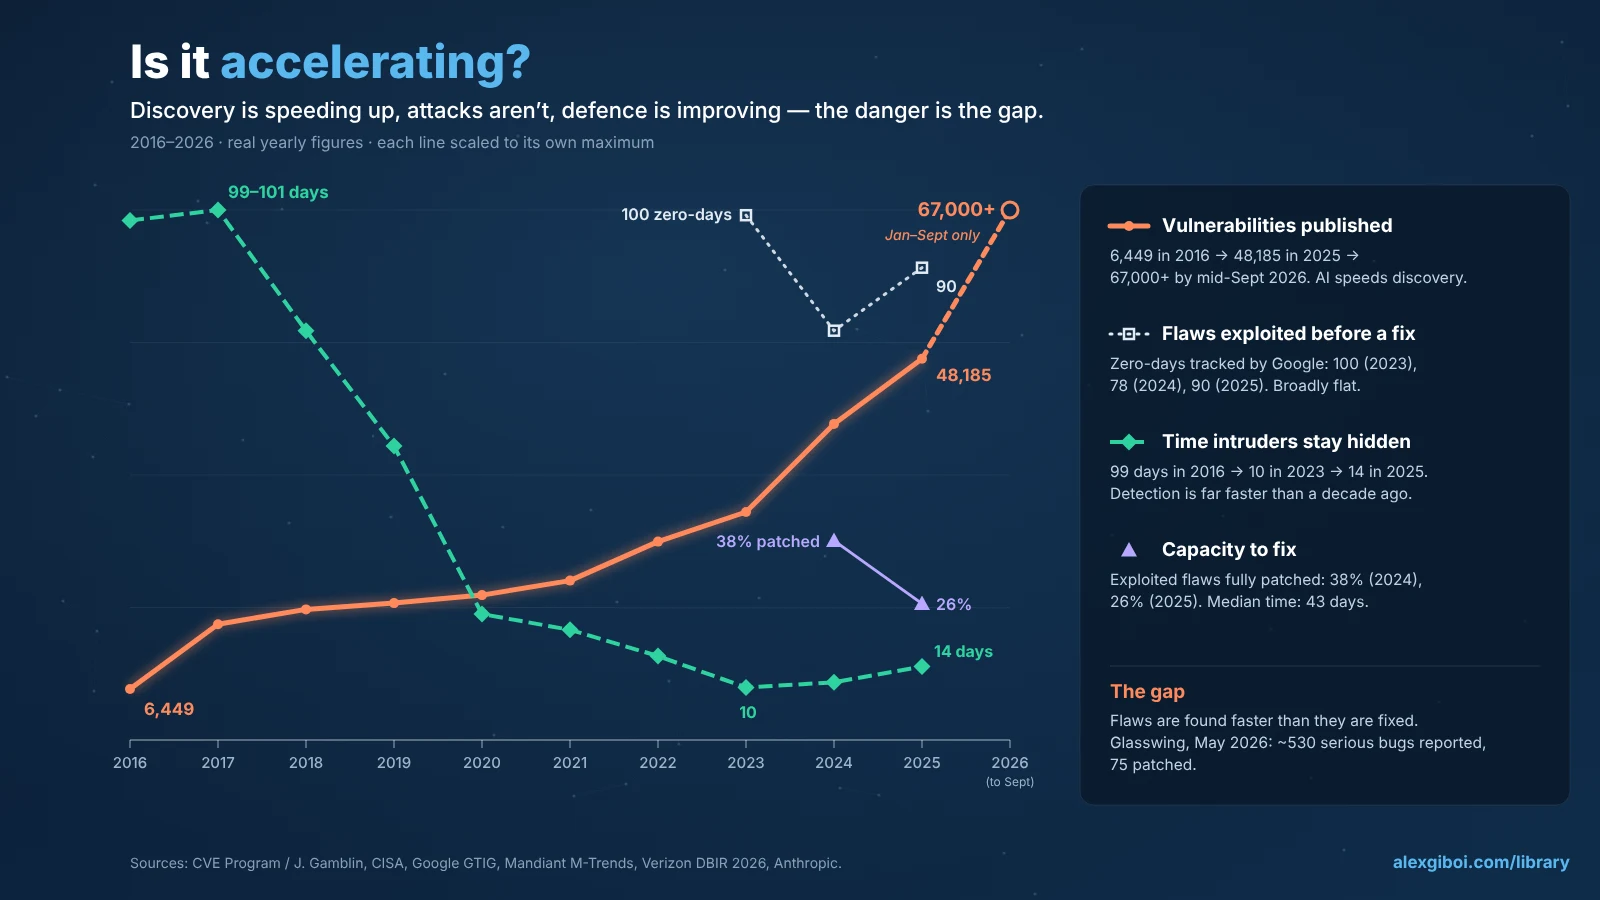
In 2016 the CVE programme published about 6,450 vulnerabilities. In 2025 it published 48,185, a record and 20.6% more than the year before. The early jump in 2017 is mostly bookkeeping — the programme expanded the number of organisations allowed to assign CVEs — but look at the growth rate after that: about 8% a year from 2017 to 2021, about 24% a year from 2021 to 2025. And 2026 is in another league. In June, FIRST — the global forum of incident-response teams — raised its forecast for the year to about 66,000; according to CISA, more than 67,000 had already been published by 18 September.
Part of the 2026 surge is again counting — FIRST notes that VulnCheck, acting as a "numbering authority of last resort", issued 3,119% more CVEs than a year earlier, and GitHub's advisories rose 449% — but a significant part is a new force: AI. In April 2026 Anthropic launched Project Glasswing around an unreleased model, Claude Mythos Preview; by 22 May Anthropic and its roughly 50 partners had found more than 10,000 high- or critical-severity vulnerabilities. Epoch AI found that notable organisations disclosed more than three and a half times the previous monthly record of high- and critical-severity CVEs in June 2026. PHP2Shell itself was found by researchers at the security firms Calif and Wiz using AI models, in coordination with OpenAI and the PHP team. In April, NIST announced that its National Vulnerability Database would no longer try to analyse every CVE, citing a 263% rise in submissions between 2020 and 2025. This curve is not just rising; its slope is rising. That is acceleration in the strict sense.
2. The speed from disclosure to attack
Mandiant has tracked the average "time-to-exploit" — how long after a flaw becomes known attackers start using it. It was 63 days in 2018–19, 44 days in 2020–21, 32 days in 2021–22 and just 5 days in 2023. M-Trends 2026 puts the estimated mean below zero, at about minus seven days — exploitation, on average, now starts before a patch is out. VulnCheck found that 28.9% of the vulnerabilities it recorded as exploited in 2025 were attacked on or before the day they were published. PHP2Shell illustrates it: Amazon's honeypots recorded an exploitation attempt on 17 October, four days before public disclosure.
Meanwhile defenders patch more slowly than attackers exploit. Verizon's 2026 DBIR found that only 26% of vulnerabilities in CISA's exploited catalogue were fully fixed by organisations, down from 38%, and that the median time to patch them rose to 43 days. For the first time in the report's history, exploiting a vulnerability overtook stolen credentials as the most common way breaches begin (31%, up from 20%).
3. Dependence on others
The most underrated curve is interdependence. In the 2024 DBIR, third parties were involved in 15% of breaches; in 2025, 30%; in 2026, 48%. Sonatype counted more than 454,600 new malicious open-source packages in 2025 alone, bringing its cumulative total above 1.2 million. October 2026 is full of examples of one failure becoming many: ransomware at a single Japanese cloud provider, IDC Frontier, hit 495 companies and local governments that used its service; one programming language's flaw pushed governments across Europe to switch websites off; one certificate authority's flawed key ceremony forced every major browser maker to act.
This is why the October week felt like acceleration. When much of the web runs on the same handful of components, a single flaw produces a synchronised event: everyone patches, or switches off, on the same afternoon.
4. Raw scale
The largest DDoS attacks went from about 1 terabit per second (the Mirai botnet against OVH and Dyn in 2016) to 31.4 Tbps, mitigated by Cloudflare at the end of 2025 and disclosed in February 2026 — roughly a thirty-fold increase. Cloudflare mitigated 805 attacks above 1 Tbps in the second quarter of 2026 alone, six times the previous quarter.
What is growing fast but steadily
Losses reported to the FBI rose from $1.45 billion in 2016 to $20.9 billion in 2025, crossing one million complaints for the first time. That is a 14-fold increase, about 34% a year. But the rate is remarkably constant: roughly 37% a year from 2016 to 2021, roughly 32% a year from 2021 to 2025. This is a fast exponential, driven mostly by fraud — investment scams ($8.6 billion) and business email compromise ($3.0 billion) — rather than by technical hacking. Exponential, yes; accelerating, no.
The cost of an individual corporate breach has grown much more slowly. IBM's global average went from $3.62 million in 2017 to $4.88 million in 2024, dipped to $4.44 million in 2025 — the first fall in five years, credited to faster detection — then rose to a record $4.99 million in 2026, with IBM reporting that AI-driven attacks had increased 56% and added about $1 million to the cost of a breach. Roughly 3–4% a year over the decade, with a recent jump.
What is flat
Here is the part that rarely makes headlines. The number of zero-days — flaws exploited before any fix exists — that Google's threat intelligence group tracks each year has sat in a 60–100 band for four years: 100 in 2023, 78 in 2024, 90 in 2025. CISA's catalogue of vulnerabilities known to be exploited added 187 entries in 2023, about 185 in 2024 and 245 in 2025 — up, but nothing like the CVE curve. VulnCheck found that of 1,061 publicly attributed AI-assisted discoveries in the first half of 2026, 14 (1.3%) had been confirmed as exploited — roughly the rate for vulnerabilities overall.
FIRST's forecasters reach the same conclusion: once the flood of new CVEs is filtered for the ones attackers actually use or are likely to use, the actionable burden has stayed essentially flat. Jerry Gamblin, one of the forecast's authors, put it as rain that doesn't stop — the job is no longer counting the drops but knowing which ones will overrun the levee. Ransomware revenue tells a similar story. On-chain payments tracked by Chainalysis jumped in 2020 and have since moved in a band of roughly $0.6–1.25 billion a year: $983 million in 2021, a record in 2023 ($1.1 billion as first reported, later revised to about $1.25 billion), $892 million in 2024, $820 million in 2025 — even though claimed attacks rose about 50% in 2025.
What is getting better
Defenders have real victories, and they are not small.
Detection. Mandiant's global median dwell time — how long an intruder sits inside a network before being found — was 99 days in 2016 and 10 days in 2023. It rose to 14 days in 2025, driven by long espionage campaigns and North Korean fake-IT-worker schemes, so the improvement has stalled. But a decade ago an attacker had three months; now it is two weeks. Part of the fall reflects ransomware, which announces itself; part is better tooling.
Refusal to pay. In early 2019, 85% of ransomware victims handled by Coveware paid. By the third quarter of 2025, 23% did — Coveware's lowest figure on record. Chainalysis puts the 2025 payment rate at 28%, a record low. Criminals are attacking more and earning per attack less.
Safer code. In 2019, 76% of Android's vulnerabilities were memory-safety bugs, the class behind many of the worst exploits. In 2025, after Google wrote new code in memory-safe languages such as Rust, the share fell below 20% for the first time. Browser zero-days, once the elite attacker's tool of choice, fell to historic lows in Google's 2025 review. And encryption became the default: in late 2016 Google reported, for the first time, that just over half of pages loaded in desktop Chrome used HTTPS.
Institutions. CISA did not exist in 2016; it was created in 2018. The EU's NIS2 directive, DORA for finance and national cyber agencies now issue coordinated warnings within hours, as October showed. ENISA, analysing 4,875 incidents in Europe from mid-2024 to mid-2025, found that hacktivists accounted for almost 80% of them, mostly through DDoS campaigns, and that only 2% of hacktivist incidents actually disrupted a service — loud, but mostly low-impact. It named ransomware the most impactful threat.
So: is it accelerating?
| Indicator | Then | Now | Shape |
|---|---|---|---|
| CVEs published per year | 6,449 (2016) | 48,185 (2025); 67,000+ by mid-Sept 2026 | Accelerating |
| Time from disclosure to exploitation (Mandiant) | 63 days (2018–19) | 5 days (2023); est. −7 days (M-Trends 2026) | Accelerating |
| Third-party share of breaches (Verizon) | 15% (2024 DBIR) | 48% (2026 DBIR) | Accelerating |
| Largest DDoS | ~1 Tbps (2016) | 31.4 Tbps (late 2025) | Rising fast |
| Losses reported to FBI IC3 | $1.45bn (2016) | $20.9bn (2025) | Steady exponential (~30%/yr) |
| Average breach cost (IBM) | $3.62m (2017) | $4.99m (2026) | Slow rise, recent jump |
| Zero-days exploited in the wild (Google) | 100 (2023) | 90 (2025) | Flat band, 60–100 |
| Additions to CISA's exploited catalogue | 187 (2023) | 245 (2025) | Roughly flat |
| Ransomware payments (Chainalysis) | $905m (2020) | $820m (2025, preliminary) | Flat band |
| Median dwell time (Mandiant) | 99 days (2016) | 14 days (2025) | Improved, now stalling |
| Victims paying ransom (Coveware) | 85% (Q1 2019) | 23% (Q3 2025) | Improved |
| Android memory-safety bugs | 76% (2019) | <20% (2025) | Improved |
The honest answer is: yes, but not in the way the viral post implies. The number of successful attacks is not exploding; the core of what attackers actually exploit has been surprisingly stable, and defenders have measurably shortened detection, cut ransom revenue and eliminated whole classes of bugs.
What is accelerating are three things, and they compound each other:
- Discovery. Flaws are being found faster than ever, increasingly with AI. Anthropic's own May 2026 update on Glasswing reported that of about 530 high- or critical-severity bugs disclosed to open-source maintainers, 75 had been patched; some maintainers had asked it to slow down so they could keep up.
- Exploitation speed. The average window between disclosure and attack has collapsed from two months to days, and by Mandiant's latest estimate is now negative.
- Concentration. More of the world depends on fewer shared components, platforms and suppliers, so a single flaw becomes a simultaneous, global event.
Against these stands a defence curve that improves roughly linearly, and a repair capacity — volunteer maintainers, stretched IT teams, patch cycles measured in weeks — that has barely changed. The gap between how fast flaws are found and how fast they can be fixed is the real curve to watch. In 2016 that gap was measured in months. In October 2026 governments told website owners to switch off for an afternoon because there was no gap left at all.
What to watch next
- Google's 2026 zero-day review (early 2027): does the count break above 100?
- CISA KEV additions in 2026 against 245 in 2025 (FIRST projected a pace of roughly 290–300 at mid-year).
- Mandiant M-Trends 2027: dwell time and time-to-exploit.
- Patch rates: Verizon's share of exploited flaws actually fixed (26% in 2025).
- Whether AI-assisted fixing catches up with AI-assisted finding — the only trend that can close the gap.
Sources
Primary publishers are linked first; where a primary page could not be reached, the reputable outlet that reported it is named.
- Vulnerability counts. Jerry Gamblin, 2025 CVE Data Review and 2024 CVE Data Review; CVE.org-based yearly counts via CVE Details and vulnerabilitydata.io; FIRST, 2026 Vulnerability Forecast Update and SecurityBrief on the forecast; CISA's 2026 count via Cloud Security Alliance (Sept 2026); NIST, NVD prioritisation announcement (April 2026).
- AI-assisted discovery. Anthropic, Project Glasswing: An initial update (22 May 2026) and CSO Online on the update; Epoch AI, CVE severity spike; VulnCheck, State of Exploitation 1H 2026.
- Exploitation speed and dwell time. Mandiant/Google Cloud, Time-to-Exploit Trends 2023; M-Trends 2021, 2024 and 2026; the −7-day estimate as reported by the Cloud Security Alliance.
- Zero-days and exploited vulnerabilities. Google Threat Intelligence Group, 2025 Zero-Days in Review; CISA KEV annual additions as compiled by Cyble and SecurityWeek.
- How breaches start. Verizon 2026 DBIR, as reported by SecurityWeek and TechRepublic.
- Cybercrime losses. FBI IC3 annual reports: 2016, 2024, 2025 and the five-year tables in intervening reports.
- Breach costs. IBM/Ponemon, Cost of a Data Breach 2024, 2026 findings; 2017–2023 and 2025 values as reported by IBM and Infosecurity Magazine.
- Ransomware. Chainalysis 2024 and 2026 Crypto Crime Reports, via TechTarget and BleepingComputer; Coveware quarterly reports, via Security Affairs and HIPAA Journal; CISA/FBI #StopRansomware: SafePay advisory.
- Supply chain and DDoS. Sonatype, 2026 State of the Software Supply Chain; Cloudflare reporting via BleepingComputer (31.4 Tbps) and SiliconANGLE (H1 2026); Elie Bursztein, Inside Mirai.
- Defensive progress. Google, Rust in Android (Nov 2025); HTTPS in 2016 via Threatpost; ENISA, Threat Landscape 2025.
- PHP2Shell, 20–23 October 2026. CERT-EU advisory 2026-018; FBI/NSA recommendations via the American Hospital Association; ABC News (CISA, FBI, NCSC, OpenAI statements); Reuters via The Daily Record; Washington Post via ADN; Rijksoverheid (Dutch government); Dutch IT Channel; Welingelichte Kringen (ANP); LBC (UK NCSC); Jiji Press (Takaichi); Japan's national cybersecurity office posts; Help Net Security (Amazon MadPot); W3Techs.
- Other October events. GitLab via Help Net Security and SecurityOnline; Datadog Security Labs on LiteLLM; Railway security disclosure; The Hacker News on Tor relays; CSO Online and BleepingComputer on eMudhra; BleepingComputer on IDC Frontier; on Japan's "emergency": The Next Web (citing the FT and AP) and Jiji Press.
Researched and built with the help of Claude (Anthropic), based on the public sources listed above. Corrections welcome.